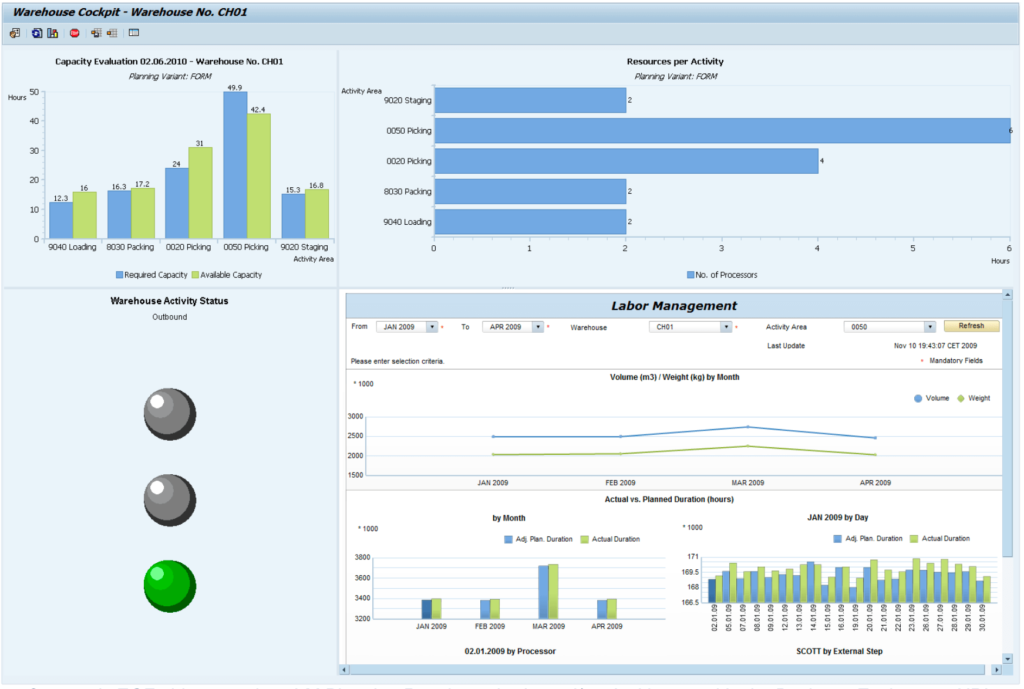
The SAP EWM Easy Graphics Framework (EGF) is a powerful monitoring tool. It enables users to visualize warehouse process data in various chart types. With EGF, you can create custom dashboards and reports that provide real-time insights into your warehouse operations. In this guide, we’ll take a closer look at how to implement EGF in your organization.
Table of Contents
What is the SAP EWM Easy Graphics Framework?
The Easy Graphics Framework is a tool that allows you to create custom dashboards and reports for your warehouse operations. With EGF, you can visualize data in different chart types such as horizontal/vertical bars and URL charts. This makes it easy to monitor key performance indicators (KPIs) and identify trends in your warehouse operations.
To use the standard EGF graphics, you must have SAP GUI 6.40 or later installed.
Getting Started with EGF
To get started with Easy Graphics Framework, you’ll need to follow these steps:
1. Define the EGF object: The first step is to define the EGF object. This includes entering the service provider implementation class, default chart type, and all other supported chart types.
2. Define a new cockpit: Next, you’ll need to define a new cockpit and cockpit input data or choose an existing cockpit to assign the new EGF object to.
3. Decide which business data to visualize: Once you’ve defined the cockpit, you’ll need to decide which business data you want to visualize in which chart types.
4. Choose input parameters: You’ll also need to choose input parameters and create a suitable input structure for your business data.
5. Customize charts: Finally, you can customize the charts in the EGF cockpit to show real-time warehouse monitoring data.
To start with, look at the example implementation delivered with standard EWM, which gives a basic overview of how static data can be visualized in an EGF chart with the most common chart types.
| Transaction | /SCWM/EGF |
| Cockpit | DEMO_COCKPIT |
| Object | DEMO_OBJECT |
| Service Provider Implementation Class | /SCWM/CL_EGF_DEMO |
| Implemented Methods | /SCWM/IF_EGF_SP~GET_DATA /SCWM/IF_EGF_SP~DRILL_DOWN |
Setting Up EGF in Customizing
To set up EGF in customizing, follow these steps:
1. Go to Extended Warehouse Management > Monitoring > Easy Graphics Framework.
2. Define the EGF object by entering the service provider implementation class, default chart type, and all other supported chart types.
3. Define a new cockpit or choose an existing cockpit to assign the new EGF object to.
4. Decide which business data you want to visualize in which chart types.
5. Choose input parameters and create a suitable input structure for your business data.
6. Customize the charts in the EGF cockpit to show real-time warehouse monitoring data.
Implementing EGF in Your Organization
To implement EGF in your organization, follow these steps:
1. Identify key performance indicators (KPIs): The first step is to identify the KPIs that are most important for your warehouse operations. This could include metrics such as order fulfillment rate, inventory accuracy, and cycle time.
2. Define the EGF object: Once you’ve identified your KPIs, you’ll need to define the EGF object and enter the service provider implementation class, default chart type, and all other supported chart types.
3. Define a new cockpit: Next, you’ll need to define a new cockpit or choose an existing cockpit to assign the new EGF object to.
4. Choose input parameters: You’ll also need to choose input parameters and create a suitable input structure for your business data.
5. Customize charts: Finally, you can customize the charts in the EGF cockpit to show real-time warehouse monitoring data.
6. Test and refine: Once you’ve implemented EGF in your organization, it’s important to test and refine your dashboards and reports over time. This will help ensure that they continue to provide valuable insights into your warehouse operations.
By following these steps, you can implement SAP EWM Easy Graphics Framework in your organization and start visualizing key performance indicators in real-time.
Automatic Data Retrieval Interval (Refresh Rate)
The SAP EWM Easy Graphics Framework (EGF) employs a refresh rate to update the data sent by a service provider for an EGF object, with a default setting of one minute.
This refresh rate is located at the EGF object level, and is checked by the EGF to determine whether a refresh is needed for the first cell in the grid. If a refresh is required, the EGF contacts the service provider and waits for its response. If the service provider responds after 10 minutes, for instance, the EGF will then wait for 10 minutes before checking whether a refresh is needed for the second cell in the grid.
ABAP EGF Function Modules
The following table gives you an overview of the important function modules in the EGF custom implementation.
| Function Module | Description |
|---|---|
| /SCWM/EGF_COCKPIT | Starts an EGF cockpit implementation. You must enter the cockpit ID as an import parameter. |
| /SCWM/EGF_CONTAINER | You transfer a container instance to the function module, such as to class CL_GUI_CUSTOM_CONTAINER, in which the required EGF object is displayed. |
| /SCWM/EGF_POPUP | The system generates a modeless dialog box in which the required EGF object is displayed. |
| /SCWM/EGF_COCKPIT_DYNAMIC | Starts an EGF cockpit dynamically. All the data required for generating the cockpit is transferred using the interfaces of the function module. No Customizing is required here. |
Summary
The SAP EWM Easy Graphics Framework (EGF) is a tool that can be used for configuring cockpits. It is generic and can be used for applications like Extended Warehouse Management (EWM). It is used in addition to text-based monitors and to display data graphically. Multiple users can work with the EGF cockpit at the same time.
Frequently Asked Questions
What is Easy Graphics Framework?
Easy Graphics Framework (EGF) is a tool that allows you to create custom dashboards and reports for your warehouse operations.
What chart types are supported by EGF?
EGF supports different chart types such as horizontal/vertical bars and URL charts.
How do I get started with EGF?
To get started with EGF, you need to take five steps. Define the EGF object. Define a new cockpit. Decide which business data to visualize. Choose input parameters. Customize charts.
How do I set up EGF in customizing?
Go to Extended Warehouse Management > Monitoring > Easy Graphics Framework. Set up EGF by customizing. Define the EGF object and cockpit.
Can I customize the charts in the EGF cockpit?
Yes, you can customize the charts in the EGF cockpit to show real-time warehouse monitoring data.
What kind of data can I visualize with EGF?
You can visualize different kinds of business data such as order fulfillment rate, inventory accuracy, and cycle time.
Is there an example implementation of EGF available?
Yes, standard EWM (transaction code: /SCWM/EGF) provides an example implementation. This implementation offers a basic overview of how static data can be displayed in an EGF chart. The most common types of charts are included.
Can I use my own input parameters for visualizing business data?
Yes, you can choose input parameters and create a suitable input structure for your business data.
How do I test and refine my dashboards and reports created with EGF?
Test and refine your dashboards and reports to make sure they are still giving you valuable insights into your warehouse operations. Do this regularly over time to ensure the accuracy of your results.
Is there any training available for EGF?
SAP provides training courses on EGF. These courses can help you learn how to use the tool. You can also learn how to create custom dashboards and reports.
Additional Information
For more information on the SAP EWM Easy Graphics Framework, please see the official documentation here and example implementation guide here.